Lakeside in Data, Part 1
This is the first part of the Lakeside in Data project, a step towards a better understanding of ourselves and those around us. Here, Tatler’s goal is to share what Lakesiders are thinking, dreaming, or believing — not just in the form of words, but also in with data. Though data cannot tell us everything, it can be incredibly useful: what better way to present the full diversity and vibrancy of our community? There’s something poetic in the idea that each of your responses contributes a sliver to a pie chart, bar graph, or scatterplot which will last for all digital eternity.
Some questions will be serious, others lighthearted; regardless, Lakeside in Data is a project by students, for students.
October 2022 Tatler Poll: 125 participants
World Languages
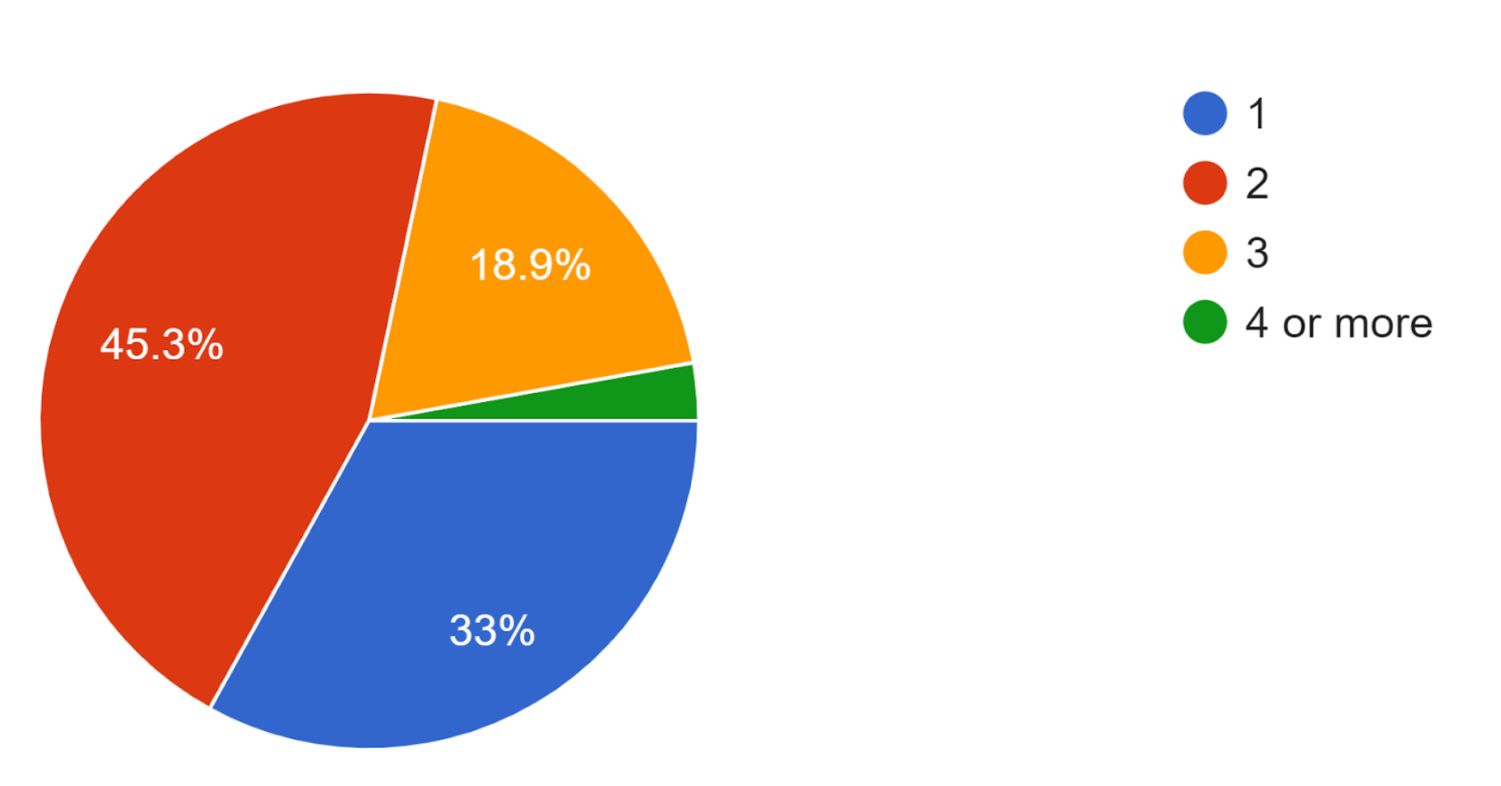
We asked Lakesiders how many languages they could fluently speak (our standard for “fluency” was the ability to order a meal at a restaurant in the language with ease).
Favorite Number
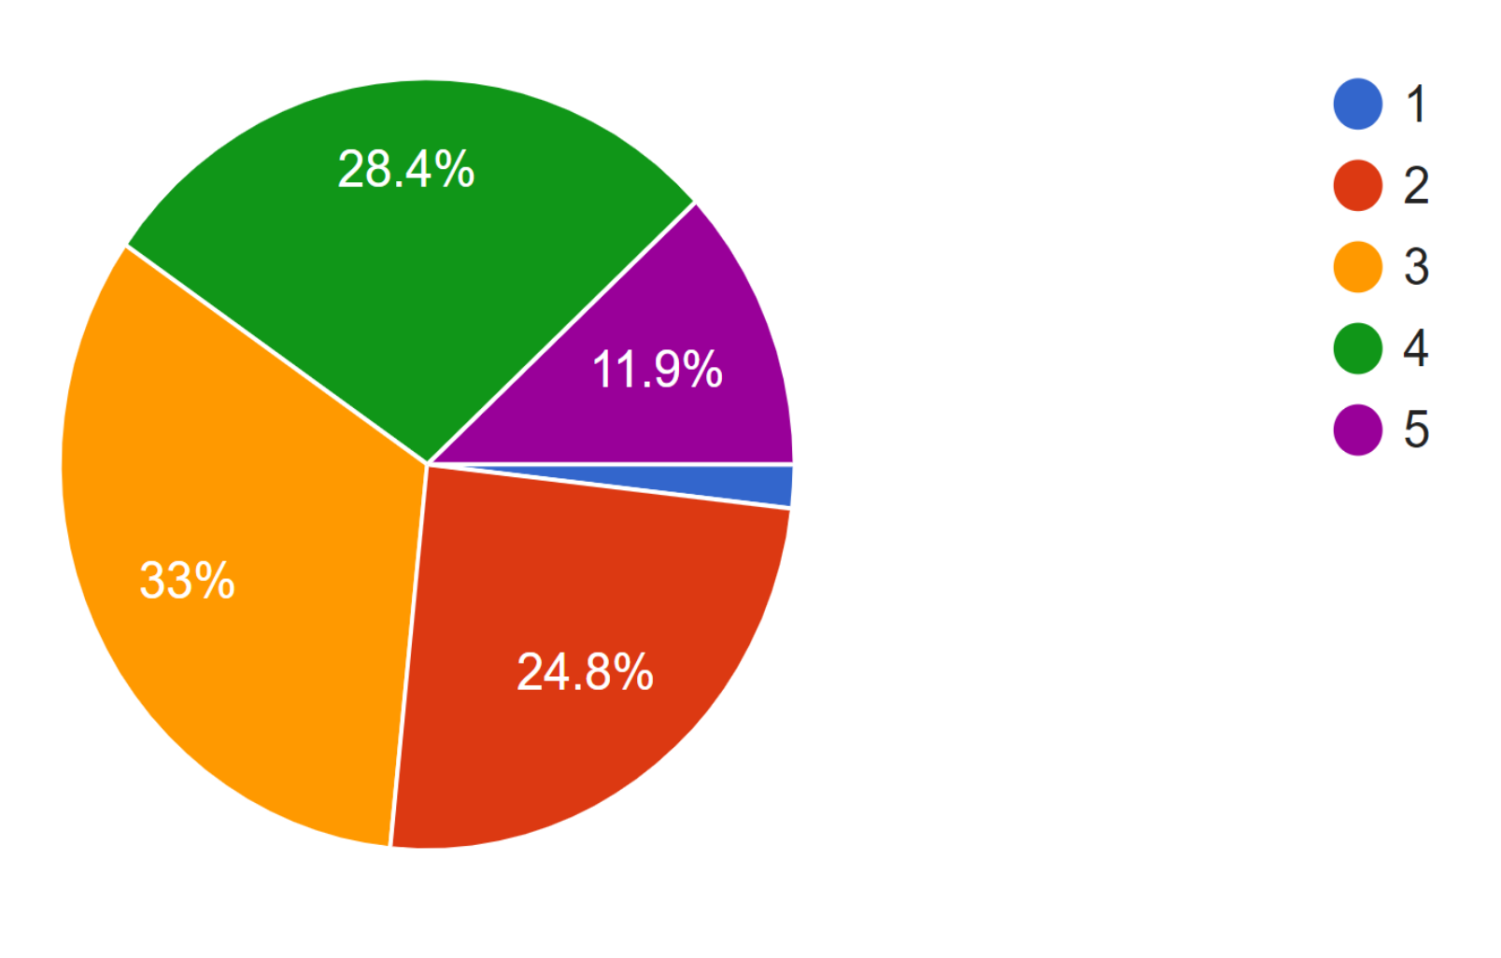
We asked Lakesiders for their favorite number between one and five. The winner was three, a number associated with harmony, wisdom and understanding.
Then, to test how well Lakesiders can tap into the school’s collective consciousness, we asked them what they thought everyone else’s favorite number would be…
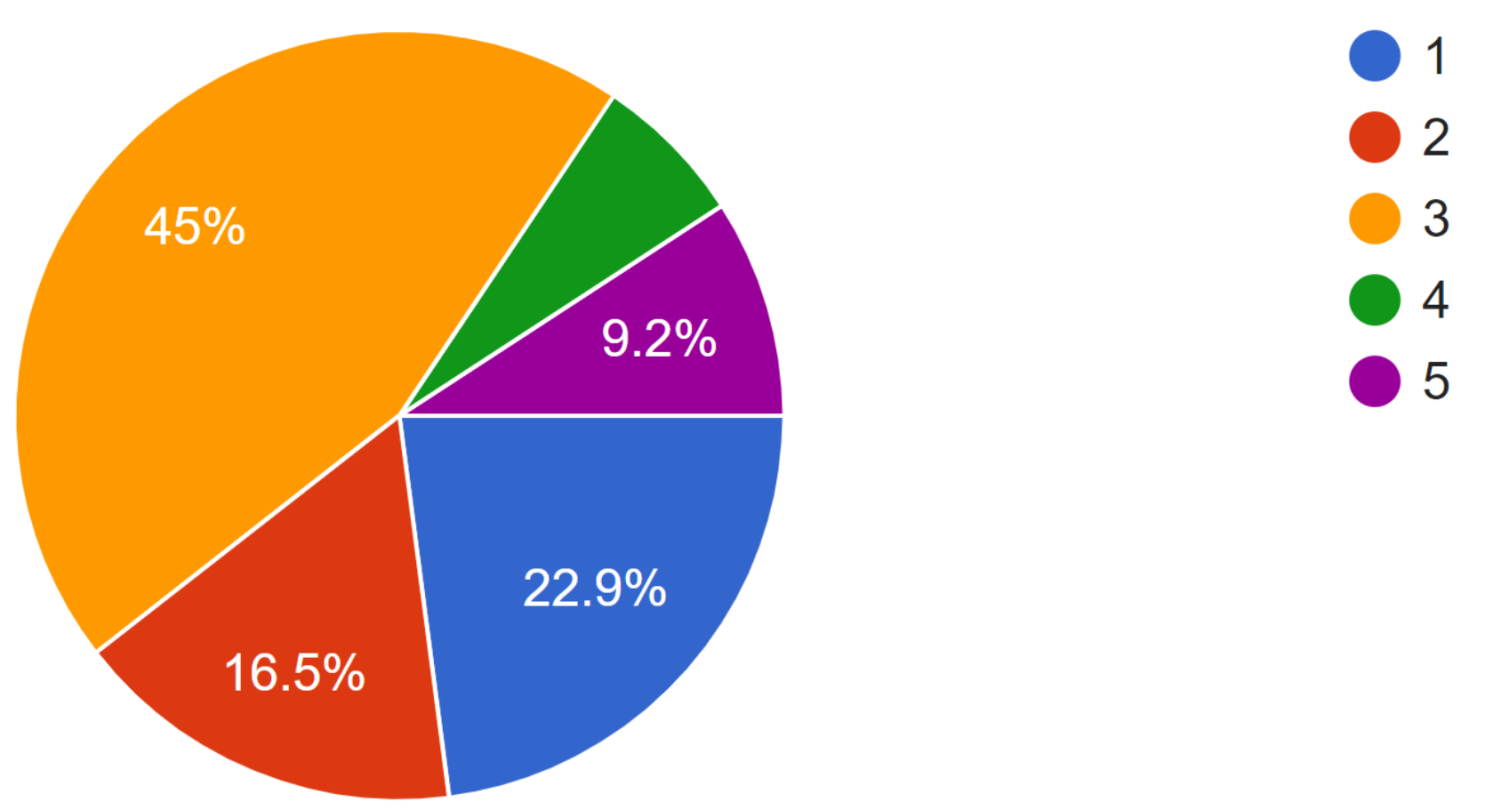
…and almost half the participants were right! For those of you who think this might just be a coincidence, ask someone taking Statistics to do a chi-squared test for you.
The Lakeside in Data project is a means for informing ourselves about our own school. If you want to know more about Lakeside and yourself, make sure to participate by filling out next month’s Tatler poll!